News
Added StackExchange flair widgets, one for StackOverflow in the menu under Data & IT and corresponding flair widget for Project Management under Processes & Projects.
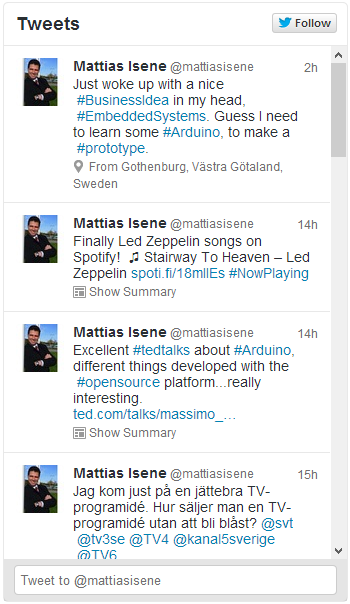
Read some about how to embed Twitter Timeline and since it did not seem to be that hard I thought I could implement it quite fast.
It actually was quite easy, though I could not see it in my Chrome web browser. It worked in both Internet Explorer and Mozilla Firefox. No clues from Stackoverflow either. Then I saw that Adblock Plus was active and deactivated it for my site and then it worked. Added some info regarding this to the page as well.
I have followed a tutorial how to use PDO (PHP Data Objects) and rewritten code to use PDO.
The tutorial also covered how to implement very good cryptology of passwords, and now it works very well.
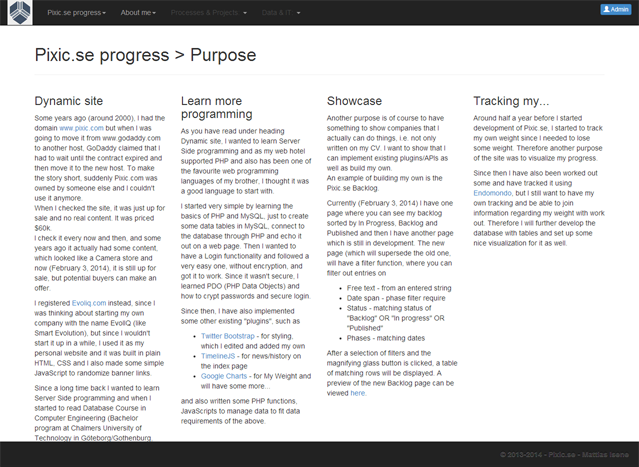
Also have created my first admin page, so I can update via the webpage directly...this one is from that web page.
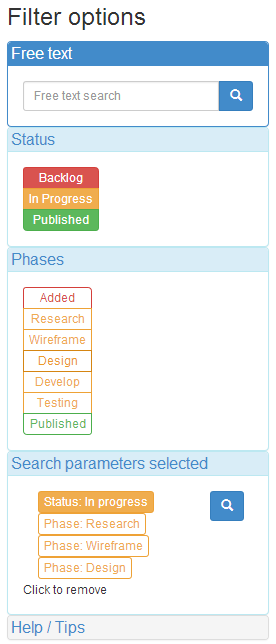
I have started the redesign och the Pixic.se Backlog. The current solution show all entries by status; Backlog, In progress and Published. When I end up with many entries it will be almost impossible to find what you are looking for.
Therefore the New Backlog will have filter functions such as Free text filter and Parameter filter. Parameters will be on Status values, Phase values (dates), DateTime between (using date picker) and perhaps more later.
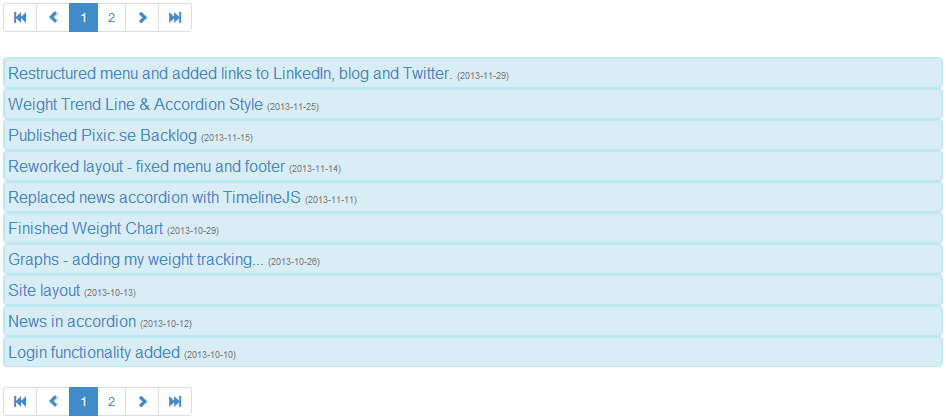
I added pagination to News - as list, because it would have been very slow when reaching 200 news posts.
Now that I know how to do it, I will probably use is it when restructuring the Pixic.se Backlog. I think the best solution for the Backlog is to have all rows in a table and then add a search menu, where you can search in a free text field as well as have predefined search for Published, In progress and Backlog as well as different phases for the In progress.
A couple of days ago, I restructured the menu be more clear regarding Pixic.se progress and About me.
Pixic.se progress includes
- News - as timeline (i.e. start page)
- News - as list (accordion style)
- Pixic.se Backlog - table
About me includes links to
- Profile @ LinkedIn profile
- My blog @ Evoliq.com (since I have not moved it to Pixic.se yet)
- My tweets @ Twitter
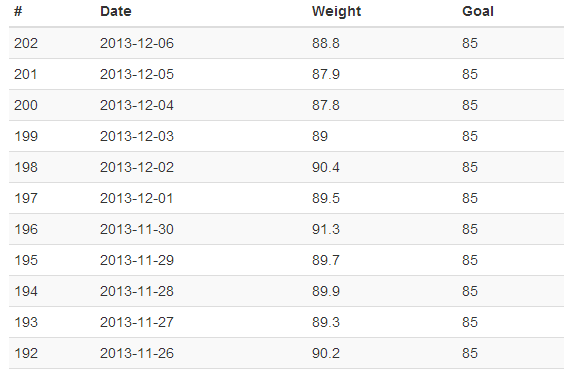
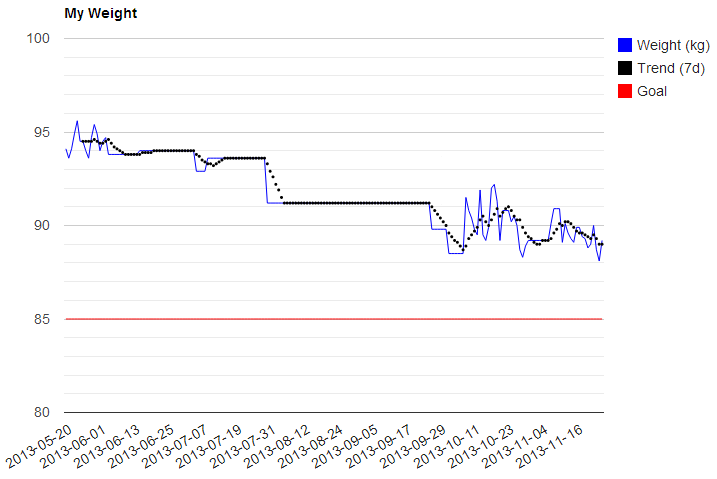
- My weight

I added a trend line to the chart My weight. Did it by defining an array and for each date I added an array with date as key and weight as value. Filling up the array in the beginning (days less than 7) and when I had 7 I calculated the sum of all values in the array and then divided by 7 to get average. Then for all subsequent dates, I am sorting the array, removing the first one, i.e. the oldest, and then merging in the last date and thereby get a trend.
I also added some styling to the News - as list, making it look a bit neater.
I created the database table for the Backlog earlier but modified it by adding some development phases.
Then started to think how I could present all data. Wanted to have it in table form and will later develop some chart(s), either simple pie or perhaps a burndown chart.
